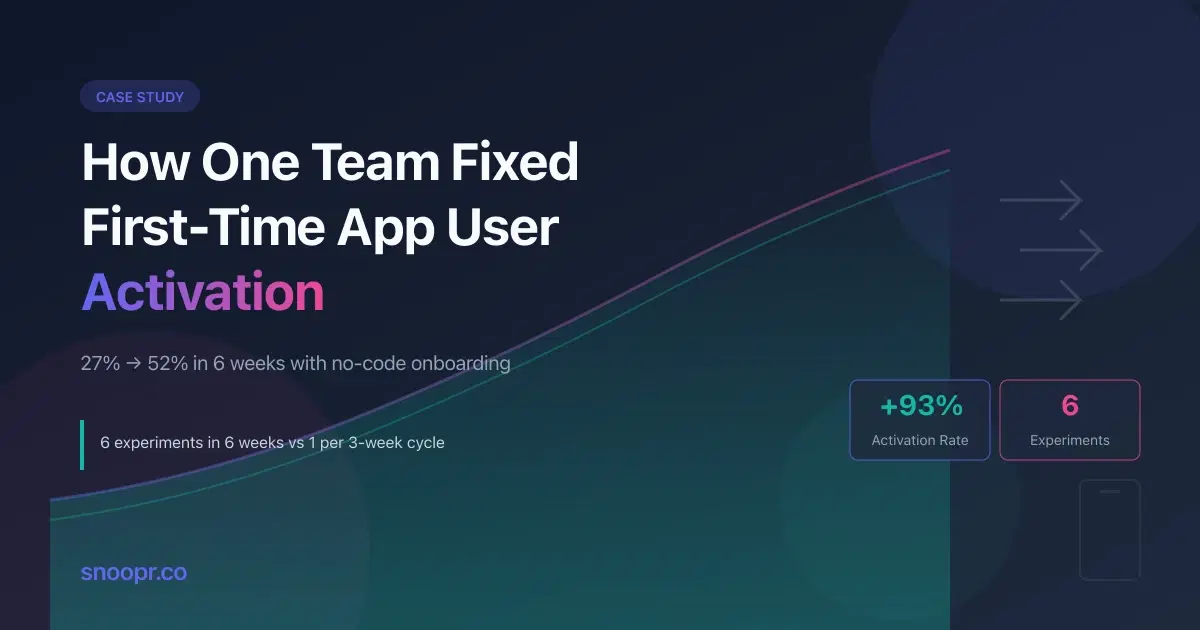
A Series A fitness app doubled their customer activation rate from 27% to 52% in six weeks by switching from traditional development cycles to Snoopr's no-code mobile onboarding platform. They ran six experiments in the time it would have taken to ship one code change.
This case study walks through exactly how they did it: the specific screens they built, the metrics they moved, and why iteration speed (not better ideas) was the difference between a struggling app and a thriving one.
If you're losing first time app users before they experience value, this is the playbook for fixing it fast.
Key Points
- A fitness app losing 73% of new app users switched to no-code onboarding and ran 6 experiments in 6 weeks, compared to 1 experiment per 3-week traditional cycle
- Customer activation jumped from 27% to 52% by reordering screens to show value before asking for profile data
- Snoopr's visual builder and instant publishing eliminated the App Store review bottleneck that was killing their iteration speed
The Problem: 73% of First Time App Users Gone Before Value
The global average Day 1 retention rate for mobile apps is just 25.3% according to Statista. That means three out of four new app users never return after their first session. For this Series A fitness app with 200,000 monthly active users, the number was even worse: only 27% of first time app users completed their first workout.
The product team knew exactly where users dropped off. Their analytics showed 61% abandonment at the third onboarding screen, a profile setup asking for height, weight, and fitness goals. Users wanted to work out, not fill out forms.
The obvious fix: Show users a workout first, then ask for profile information after they'd experienced value.
The problem: Reordering those screens required:
- Refactoring authentication flows
- Updating the workout recommendation engine
- Testing across 14 device configurations
- App Store review (2-7 days)
Engineering estimate: six weeks.
Six weeks to test whether screen order mattered.
At that pace, the team could run approximately 8 onboarding experiments per year. Meanwhile, AppsFlyer data shows that 49% of apps are uninstalled within 30 days, and half of those deletions happen on Day 1. Every week of slow iteration meant more users lost.
The Solution: No-Code Onboarding with Snoopr
Snoopr takes a different architectural approach to mobile onboarding. Instead of hardcoding screens into the app binary, Snoopr separates onboarding content from the rendering engine:
| Traditional Approach | Snoopr Approach |
|---|---|
| Onboarding screens compiled into app | Onboarding content served from CDN |
| Every change requires code | Changes made in visual builder |
| App Store review for each update | Instant publishing, no review |
| 3-6 week iteration cycles | Same-day changes |
How it works:
1. Install Snoopr's SDK once (10 lines of code, ~30 minutes)
2. Build onboarding flows in a Figma-like visual canvas
3. Publish instantly. Users see changes on next app open
4. A/B test variations without touching code
The engineer integrated the SDK by 3 PM on a Tuesday. By 5 PM, the product lead had built the "workout first, profile later" flow that engineering estimated would take six weeks.
The Experiment: Six Weeks, Six Tests, One Result
With Snoopr, the product team ran six experiments in six weeks. Here's what they tested and what they learned:
Week-by-Week Breakdown
| Week | Experiment | Result |
|---|---|---|
| 1 | Workout preview before profile setup | +12% completion |
| 2 | Video thumbnail vs. static workout images | +8% completion |
| 3 | Reduced profile fields from 6 to 3 | +11% completion |
| 4 | Added "2 minutes to first workout" progress indicator | +6% completion |
| 5 | Personalized headlines by acquisition source | +4% completion |
| 6 | "Start My First Workout" vs. "Get Started" CTA | +14% completion |
Final result: Customer activation went from 27% to 52%, a 93% improvement.
These weren't revolutionary ideas. Any product team would hypothesize that showing value before asking for data improves conversion. The difference was Snoopr let them validate six hypotheses while a traditional approach would have validated one.
Why Iteration Speed Beats Better Ideas
Research from Fanana shows that apps with optimized activation strategies achieve 3-5x higher retention rates. But optimization requires experimentation, and experimentation requires speed.
The math that matters:
| Approach | Experiments/Year | Meaningful Wins (at 20% success rate) |
|---|---|---|
| Traditional (3-week cycles) | ~17 | ~3.4 |
| With Snoopr (same-day changes) | ~100+ | ~20+ |
According to Userpilot's benchmark report, a 25% improvement in new user activation leads to a 34% increase in monthly recurring revenue. This team's 93% activation improvement didn't just retain more users. It fundamentally changed their unit economics.
The insight here isn't that this team had better product instincts than competitors. It's that Snoopr let them act on those instincts 10x faster.
The Winning Flow: Screen by Screen
Here's exactly what the optimized onboarding looked like after six weeks of iteration with Snoopr:
Screen 1: The Hook (0-6 seconds)
- Visual: 6-second looping video of someone completing a quick workout
- Headline: "Your first workout takes 7 minutes. Ready?"
- CTA: "Show me"
No logo. No welcome message. No feature explanation. Appcues research shows that if onboarding takes longer than 2 minutes, users give up entirely. So they front-loaded value in the first 6 seconds.
Screen 2: The Preview (6-20 seconds)
- Visual: Scrollable preview of the actual first workout (exercises, duration, equipment needed)
- Headline: "Here's your first session"
- CTA: "Looks good, let's do it"
This screen answers the question every first time app user asks: "What will I actually get from this?" Snoopr's carousel and image grid elements made this interactive preview possible without custom code.
Screen 3: The Minimal Ask (20-40 seconds)
- Fields: First name + one goal (lose weight, build muscle, stay active)
- Headline: "Quick question so we can personalize this"
Only after demonstrating value did they ask for anything. And they asked for the minimum: 3 fields instead of 6. Business of Apps data shows the average onboarding checklist completion rate is just 19.2%. Fewer steps = higher completion.
Screen 4: The Commitment (40-50 seconds)
- Summary: "Alex, you're starting with a 7-minute full-body workout. No equipment needed."
- CTA: "Start workout"
Total time: under 60 seconds. Fanana's research shows top-performing apps achieve time-to-value under 60 seconds, while average apps take 5+ minutes.
What They Removed (And Why It Mattered)
The screens they eliminated were just as important as the screens they kept:
| Removed Element | When It Moved To | Impact |
|---|---|---|
| Account creation | After first workout | Eliminated #1 friction point |
| Detailed profile (height, weight, history) | Settings (optional) | Reduced form abandonment |
| Feature tour | Eliminated entirely | Stopped explaining, started showing |
| Permission requests | Triggered contextually (e.g., notifications after workout ends) | Reduced privacy objections |
CleverTap research shows that poor registration experience accounts for 15.6% of app uninstalls, while security/privacy concerns drive 29.6%. By moving these friction points to after value was demonstrated, they eliminated two of the top uninstall triggers.
Snoopr's targeting capabilities let them show different flows to different segments. New users got the streamlined experience while returning users skipped straight to content.
The Competitive Advantage: Learning Faster Than Everyone Else
While this team ran their sixth experiment, competing fitness apps were still waiting for App Store approval on January's changes. According to AppsFlyer, 77% of users abandon apps within the first 3 days. Every week of slow iteration means more first time app users lost permanently.
The compounding effect:
Their competitors will eventually discover that workout-first onboarding performs better. They'll eventually simplify their profile setup. But by the time they implement and test those ideas, this team will have moved on to the next round of optimizations.
This is the structural advantage of Snoopr: not smarter ideas, but faster learning. And in mobile app customer activation, faster learning compounds into an insurmountable gap.
Snoopr Features That Made This Possible
This team's success relied on specific Snoopr capabilities:
Visual Canvas Builder
A Figma-like design environment with 20+ mobile-native element types. The team built their video preview, interactive workout cards, and progress indicators without writing CSS or custom code.
AI Content Generation
Snoopr's AI generates complete onboarding flows (headlines, body copy, CTAs) in about 60 seconds. The product lead created first drafts in minutes instead of hours, then refined using the visual editor.
Instant Publishing
Click publish, and changes go live immediately. No App Store submission. No 2-7 day review wait. No gradual user update rollout. This is what enabled same-day experimentation.
A/B Testing with Control Groups
Run parallel experiments with proper statistical controls. The team tested 5 variations simultaneously in Week 6, finding the winning CTA in days instead of months.
MTU Pricing
Snoopr charges for Monthly Tracked Users (users who actually see onboarding), not all active users. For apps where only 30% of MAUs see onboarding, this reduces costs by 70%.
Your First Day with Snoopr
If these results resonate, here's what your first day looks like:
| Time | Action |
|---|---|
| Hour 1 | Sign up at snoopr.co, explore the visual builder |
| Hour 2 | Engineer integrates SDK (~10 minutes for React Native) |
| Hour 3 | Build first onboarding flow using AI-generated content |
| Hour 4 | Publish to test group, see it live on device |
| End of Day 1 | First A/B test running: current onboarding vs. new flow |
| Week 1 | First results with real data on customer activation |
This isn't theoretical. Snoopr's 30-day free trial includes full access to the visual builder, AI generation, and A/B testing. No credit card required.
Results Summary
| Metric | Before Snoopr | After Snoopr | Change |
|---|---|---|---|
| Customer activation rate | 27% | 52% | +93% |
| Iteration cycle time | 3-6 weeks | Same day | -95% |
| Experiments per 6 weeks | 1 | 6 | +500% |
| Engineering hours for onboarding | 40+ hours/change | 0 (after SDK install) | -100% |
FAQ
How quickly can teams improve first time app user activation with Snoopr?
Most teams see measurable improvements within 2-3 weeks of using Snoopr. This team's first experiment (reordering screens) showed a 12% improvement in Week 1. The key factor is iteration speed: teams that run 5+ experiments in their first month consistently outperform those running 1-2. Snoopr's same-day publishing means you can act on data immediately rather than waiting weeks for App Store approval.
What's a good benchmark for mobile app customer activation?
Industry benchmarks vary significantly by category. According to UXCam's 2025 research, Day 1 retention (a proxy for activation) ranges from 14-15% for education apps to 35-40% for hyper-casual gaming. Fanana's data shows productivity apps typically see 20-30% activation rates, while e-commerce apps see 15-25%. Any rate above 35% is considered exceptional. Snoopr customers typically improve their activation rates by 25-75% within the first quarter.
How does Snoopr compare to traditional mobile development for onboarding changes?
Snoopr reduces onboarding iteration time from weeks to hours. Traditional changes require engineering sprints, QA testing, and App Store review (2-7 days for Apple, 1-3 days for Google). Snoopr's architecture separates content from code: install the SDK once, then make unlimited changes through the visual builder with instant publishing. This team's "6-week engineering estimate" became a "same-day product manager task."
What percentage of new app users typically complete onboarding?
The global average onboarding completion rate is just 8.4% by Day 30, according to Business of Apps. The average checklist completion rate is 19.2%. Research from Pendo shows that tours with more than 5 steps see sharp drop-offs. Each additional step reduces completion by 10-15%. Snoopr helps teams test shorter, more focused flows to maximize completion.
Why do most first time app users abandon apps so quickly?
49% of apps are uninstalled within 30 days, with half of those deletions happening on Day 1, according to AppsFlyer. The top reasons: not in use (39.9%), limited storage (18.7%), and excessive advertising (16.2%). Poor registration experience (15.6%) and privacy concerns (29.6%) also drive uninstalls, both of which happen in the first session. Snoopr lets teams rapidly test different first-session experiences to find what reduces these abandonment triggers.
Get Started
Your first time app users are making decisions right now. The question is whether you can iterate fast enough to influence those decisions.
- Start Free Trial → - 30 days, full access, no credit card
- Book a Demo → - See the visual builder and A/B testing in action
- View Developer Docs → - React Native SDK integration guide
This team went from 27% to 52% activation in six weeks. What's your number, and how fast can you move it?