Key Takeaways
- Day 1 retention benchmark: 25-30% across all categories, but top performers hit 40%+
- Day 30 retention benchmark: 5-10% is average; above 10% is strong for most categories
- Fitness apps: 20% Day 1, 7% Day 7, 3.5-4% Day 30
- Ecommerce apps: 24.5% Day 1 (general shopping) to 33.7% Day 1 (marketplaces)
- Gaming apps: 28-32% Day 1, but 97%+ churn by Day 30
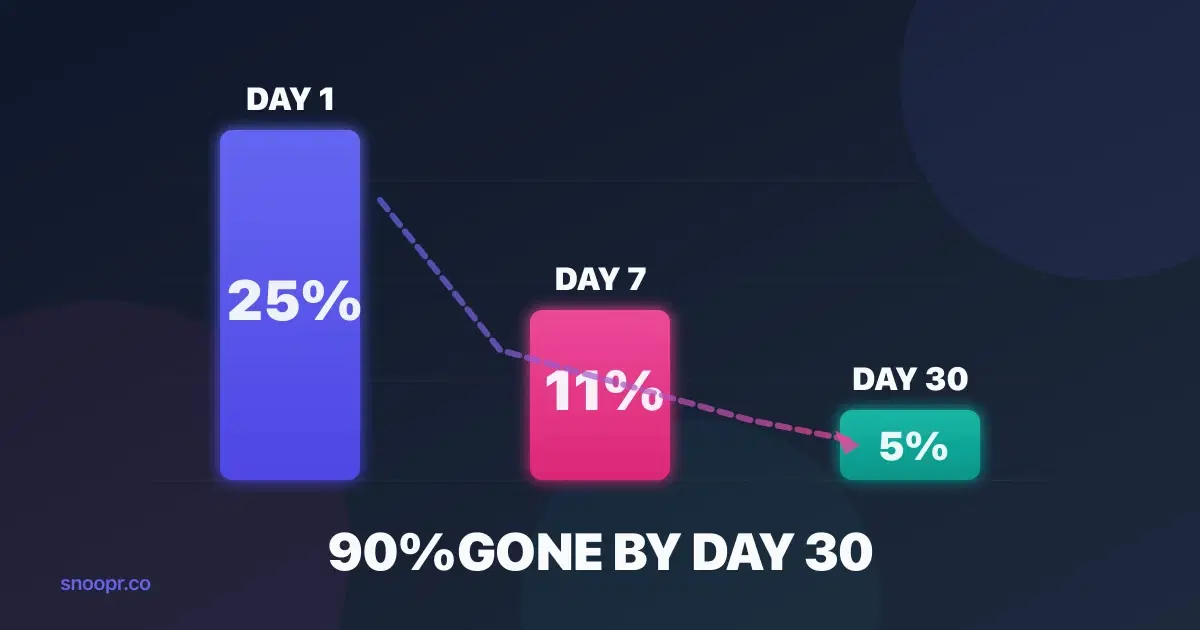
- The gap: 90% of mobile app users are lost within 30 days of install
A good mobile app retention rate in 2026 is 25-30% on Day 1, 10-15% on Day 7, and 5-10% on Day 30—but these numbers vary dramatically by industry. Fitness apps averaging 20% on Day 1 are performing well, while gaming apps need 28-32% to hit the same benchmark. Ecommerce apps face even wider variance: general shopping apps retain 24.5% on Day 1, but marketplace apps like Amazon and eBay hit 33.7%.
This guide breaks down retention benchmarks by industry, platform, and timeframe so you can measure your app against the right standard—not a generic average that doesn't reflect your category's reality.
What Is a Good App Retention Rate? The 2026 Baseline
A good app retention rate depends entirely on your category, but here's the cross-industry baseline for 2026:
| Timeframe | Average | Good | Excellent |
|---|---|---|---|
| Day 1 | 25% | 30% | 40%+ |
| Day 7 | 10.7% | 15% | 20%+ |
| Day 30 | 5-6% | 7-10% | 10%+ |
According to Business of Apps, mobile apps lose 90% of their daily active users within the first 30 days of install. The average churn rate within the first 3 days alone is 72%.
These numbers sound brutal—and they are. But they also reveal an opportunity: if you can beat the average at Day 7 and Day 30, you're already outperforming most of your competition.
The challenge is that most teams can't iterate on their onboarding fast enough to find what works. Traditional mobile development cycles mean testing one retention hypothesis takes 3+ weeks. Tools like Snoopr exist specifically to solve this: update your onboarding instantly, A/B test variations without app store delays, and find winning approaches before your users churn.
Mobile App Retention Benchmarks by Industry (2026)
Comparing your retention to a cross-industry average is misleading. A 20% Day 1 retention rate would be catastrophic for a gaming app but excellent for an education app.
Here's what "good" actually looks like in each major category:
Finance & Banking Apps
Finance apps have the highest retention rates of any category.
| Timeframe | Benchmark |
|---|---|
| Day 1 | 30.3% |
| Day 7 | 17.6% |
| Day 30 | 11.6% |
According to Statista research cited by Business of Apps, traditional and digital banking apps combined achieve these industry-leading benchmarks. The reason: high utility and daily relevance. Users check balances, pay bills, and monitor transactions regularly.
Finance apps also benefit from trust barriers—once users set up their accounts, switching costs are high. This creates natural stickiness that other categories don't enjoy.
For fintech teams looking to improve these numbers further, Snoopr enables rapid testing of different onboarding sequences. Testing whether showing account balance immediately (value-first) outperforms a feature tour can be done in days, not weeks.
Gaming Apps
Gaming apps see the highest Day 1 retention but also the steepest drop-off.
| Timeframe | Casual Games | Hyper-Casual | Hardcore |
|---|---|---|---|
| Day 1 | 28.7% | 32.2% | 28.7% |
| Day 7 | 7.9-12.6% | 7.9% | 12.6% |
| Day 30 | 2.3-5.4% | 2.3% | 5.4% |
According to Business of Apps gaming data, hyper-casual games have the highest churn by Day 30 at 98.6%, while match games have the lowest churn in the gaming category.
Platform matters significantly for gaming:
| Platform | Day 1 | Day 30 |
|---|---|---|
| iOS | 35.7% | 5% |
| Android | 27.5% | 2.6% |
iOS gaming retention is 30% higher on Day 1 and nearly double on Day 30. This gap reflects device quality, user demographics, and the fragmented Android ecosystem.
The gaming insight that applies across categories: the first session determines everything. Gaming apps that hook users immediately see dramatically better Day 7 and Day 30 numbers. This is why the ability to test and optimize your first-session experience rapidly—which Snoopr enables for onboarding flows—creates compounding retention advantages.
What Is a Good App Retention Rate for the Fitness Industry?
A good fitness app retention rate is 20% on Day 1, 7-8.5% on Day 7, and 3.5-4% on Day 30.
| Timeframe | Health & Fitness | Medical/Digital Health |
|---|---|---|
| Day 1 | 20% | 20.2% |
| Day 7 | 7% | 8.5% |
| Day 30 | 3.5% | 4% |
Fitness apps face a unique challenge: their value is delayed. Unlike a banking app where users see immediate utility, fitness apps require users to complete workouts, track progress over time, and develop habits before experiencing results.
According to AppsFlyer data, health and fitness apps see 2.78% retention at Day 30 in some reports—even lower than the benchmarks above.
What separates high-retention fitness apps:
- Immediate value delivery: Let users complete a workout in the first session before asking for profile data
- Progress visualization: Show users their activity immediately, even if it's just "Day 1 complete"
- Habit triggers: Push notifications timed to user behavior patterns
The pattern here is consistent: front-load value, delay asks. Snoopr helps fitness apps test different onboarding sequences—like showing a sample workout before signup vs. requiring registration first—and measure the retention impact directly.
What Is a Good App Retention Rate for the Ecommerce Industry?
Ecommerce retention varies dramatically by sub-category. General shopping apps retain 24.5% on Day 1, but marketplace apps retain 33.7%.
| App Type | Day 1 | Day 7 | Day 30 |
|---|---|---|---|
| General Shopping | 24.5% | 10.7% | 5.6% |
| Marketplace (Amazon, eBay, Poshmark) | 33.7% | 16.1% | 8.7% |
According to Growth-onomics benchmarks, marketplace apps outperform general shopping apps by 37% on Day 1 and 55% on Day 30.
The difference? Marketplace apps have inherent variety and discovery. Users return to browse new listings, check on items they're watching, and explore categories. General shopping apps often lack this "what's new" pull.
Ecommerce retention trends (2023-2024):
Between 2023 and 2024, marketplace app retention declined slightly:
- Day 1: 27% → 25%
- Day 7: 16% → 15%
- Day 30: 9% → 8%
This downward trend reflects increasing competition and rising user expectations. Teams that can iterate on their first-user experience faster will capture share from those stuck in slow development cycles.
For ecommerce apps, Snoopr enables testing different value propositions in onboarding—like leading with personalized recommendations vs. showing top deals—without engineering dependencies.
Social Media Apps
Social apps retain at roughly average rates but achieve exceptional stickiness (DAU/MAU).
| Timeframe | Benchmark |
|---|---|
| Day 1 | 26.3% |
| Day 7 | 9.3% |
| Day 30 | 3.9% |
While Day 30 retention looks modest, social apps compensate with extraordinary engagement among retained users. According to CleverTap research:
| App | DAU/MAU Ratio |
|---|---|
| 83% | |
| 50%+ | |
| Average (all categories) | 20% |
WhatsApp users open the app approximately 30 times per day. This level of engagement means that even if Day 30 retention is "only" 3.9%, those retained users represent massive lifetime value.
News Apps
News apps have the highest Day 1 retention outside of finance—33.1%.
| Timeframe | Benchmark |
|---|---|
| Day 1 | 33.1% |
| Day 7 | Above average |
| Day 30 | Above average |
According to Business of Apps, news apps surpassed the second-highest industry by 6.2 percentage points. The driver: daily habit formation around news consumption.
Education Apps
Education apps have among the lowest retention rates—14-15% on Day 1 and just 2-3% on Day 30.
| Timeframe | Benchmark |
|---|---|
| Day 1 | 14-15% |
| Day 7 | Below average |
| Day 30 | 2-3% |
Education apps face the same delayed-value problem as fitness apps, but more severely. Learning outcomes take weeks or months to materialize. Users download education apps with good intentions but struggle to maintain engagement.
The education apps that beat these benchmarks share a common trait: they deliver micro-wins in the first session. Duolingo, for example, lets users complete a full lesson immediately—no signup required—creating a sense of accomplishment before asking for commitment.
This onboarding pattern can be tested and optimized rapidly using Snoopr, helping education apps find the sequence that maximizes first-session completion.
Photography & Lifestyle Apps
Photography apps have the lowest Day 30 retention of any category at 1.5%.
| Timeframe | Photography | Lifestyle |
|---|---|---|
| Day 30 | 1.5% | Low |
According to UXCam benchmarks, photography apps and education apps occupy the bottom of retention rankings. The challenge: these apps are often used for specific moments rather than daily habits.
iOS vs. Android Retention: The Platform Gap
iOS apps retain users at significantly higher rates than Android apps across every category.
| Platform | Day 1 | Day 30 |
|---|---|---|
| iOS | 23.9% | 3.7% |
| Android | 21.1% | 2.1% |
iOS retention is 13% higher on Day 1 and 76% higher on Day 30. According to Business of Apps, this gap persists across categories.
Why the platform gap exists:
1. Device consistency: iOS devices have standardized hardware and fewer performance issues
2. User demographics: iOS users skew toward higher income and potentially more patience for premium experiences
3. Storage constraints: Android's broader device range includes more storage-limited phones—and storage is the #1 reason users uninstall apps
4. OS fragmentation: Android's fragmented versions create more edge cases and bugs
What this means for your retention strategy:
If your user base skews Android, your onboarding needs to be tighter:
- Optimize for lower-end devices with fast load times
- Minimize app size (Android users cite storage as top uninstall reason)
- Test on diverse devices, not just flagships
Retention by Geography: Regional Benchmarks
Day 30 retention varies by 3x depending on geography—from 6% in Finland/Japan to 2% in the Philippines.
| Region/Country | Day 30 Retention |
|---|---|
| Finland | ~6% |
| Japan | ~6% |
| North America | Highest (by region) |
| Latin America | Lowest (by region) |
| Philippines | 2.08% |
According to Growth-onomics research, cultural app use patterns, mobile data costs, and device types all contribute to this disparity.
Regional insight: Features that work in North America may not succeed in Southeast Asia or Latin America. Brands expanding globally must test user behavior and adapt accordingly.
For example, tailored mobile plans—like gaming bundles for South Korea—improve retention by 25%, according to industry research.
The Stickiness Metric: DAU/MAU Ratios by Category
Retention tells you how many users come back. Stickiness (DAU/MAU ratio) tells you how often they come back.
| Category | DAU/MAU Ratio | What It Means |
|---|---|---|
| Social & Messaging | 50-80% | Users check multiple times daily |
| Productivity | 40-60% | Daily work habits drive engagement |
| Gaming | 10-30% | Session-based, not daily habit |
| Fintech & Ecommerce | 15-30% | Transactional, not continuous |
| SaaS (B2B) | ~40% | Workday usage pattern |
According to CleverTap, a DAU/MAU ratio of 20% is considered good, while above 25% is excellent.
Benchmark examples:
- WhatsApp: 83% DAU/MAU
- Slack: 60% DAU/MAU
- Facebook: 50%+ DAU/MAU
- Roblox: 22% DAU/MAU
- Candy Crush: 10-20% DAU/MAU
The average across all industries jumped to 37% in 2023, up from the historical 13% benchmark Mixpanel reported in 2017. This shift reflects both improved engagement strategies and survivorship bias—poorly-performing apps exit the market.
Subscription App Retention: Trial Conversion Benchmarks
82% of free trial conversions happen on the day of app installation. If users don't start a trial immediately, they probably never will.
| Metric | Benchmark |
|---|---|
| Average trial-to-paid conversion | 4.8% (mobile apps) |
| Trials without credit card | 14% conversion |
| Trials with credit card | 43% conversion |
| SaaS free trials | 29% conversion |
| Freemium to paid | 4.2% conversion |
According to RevenueCat's State of Subscription Apps 2025, 80% of trials start on Day 1. Hard paywalls drive 78% of trials in the first week.
Retention by subscription plan type:
| Plan Type | Day 30 Retention |
|---|---|
| Yearly (low price) | 53.7% |
| Yearly (high price) | 48.3% |
| Monthly (low price) | 22.5% |
| Monthly (mid price) | 16.4% |
| Monthly (high price) | 12.2% |
| Weekly | 3.4-4.2% |
Key insight: Weekly subscription plans churn 3x faster than monthly plans. They function as short-term trials rather than long-term commitments.
For subscription apps, Snoopr helps test different paywall timing and messaging. Testing whether showing the paywall before or after demonstrating value affects trial starts—and doing it in days instead of weeks—creates measurable revenue impact.
How Can I Improve App Retention? Proven Tactics
Improving retention isn't about guessing—it's about testing systematically and learning faster than competitors. Here are the highest-impact tactics, ranked by measurable effect:
1. Push Notifications (Up to 820% Retention Lift)
Push notifications have the single largest measurable impact on retention:
| Notification Frequency | Retention Lift vs. Zero Notifications |
|---|---|
| 1 notification | 120% higher |
| Weekly notifications | 440% higher |
| Daily+ notifications | 820% higher |
According to Airship research, users who received one push notification in their first 90 days had nearly 3x higher retention than those who received zero.
But there's a threshold: 46% of users disable notifications, and 32% uninstall the app if they receive more than 6 notifications, according to MobiLoud.
Platform differences:
- Android opt-in rate: 91.1%
- iOS opt-in rate: 43.9%
Moving from zero to weekly push notifications increases retention 6x on Android but only 2x on iOS. The platform gap creates different optimization strategies for each.
Critical stat: 95% of opt-in users who don't receive a push notification in their first 90 days will churn.
2. Personalized Onboarding (30-50% Retention Lift)
Generic onboarding loses users. Personalized onboarding keeps them.
| Tactic | Impact |
|---|---|
| Personalized experiences | 30% higher retention |
| Structured onboarding | 50% higher retention |
| Personalized onboarding playlists | 41% higher completion |
| Customized learning paths | 55% better adoption |
According to Growth-onomics, 86% of users who experience a well-structured introduction are more likely to continue using the platform.
The business case: A 5% lift in early retention can translate into 25% more ARR within twelve months.
This is exactly where Snoopr creates the most impact. Instead of building one onboarding flow and hoping it works, teams can:
- Test different sequences for different user segments
- Personalize based on acquisition source, device, or user-provided data
- Iterate in days instead of months
The teams that win retention aren't smarter—they're faster at learning what works.
3. In-App Messaging (3-4x Engagement Lift)
In-app messages boost engagement by 3x by serving as a roadmap to help users accomplish tasks, according to Business of Apps.
Key findings:
- In-app messages triggered from an in-app event increase conversions by 4x
- Personalized in-app messages significantly improve retention by providing timely, relevant information
The timing and context of in-app messaging matters more than volume. Messages that help users complete their current task outperform generic announcements.
4. Update Frequency (33% Better Retention)
Apps that release updates every 14-21 days perform 33% better in user retention.
According to Survicate research:
- 36% of apps on Google Play are updated weekly
- 73% of mobile apps are updated monthly
Frequent updates signal active development, fix bugs before they cause churn, and give users reasons to return.
5. Reduce Time to Value
The single most important onboarding metric is time to value—how quickly users experience your app's core benefit.
| Performance Level | Time to Value |
|---|---|
| Top-performing apps | Under 60 seconds |
| Average apps | 5+ minutes |
| Poor performers | Never reached |
Users who don't experience value in the first session rarely return. The apps that win retention front-load value before asking for anything—signups, permissions, or profile data.
Snoopr enables teams to test different value-first sequences: Does showing a sample result before signup outperform a feature tour? Does skipping the tutorial and going straight to the core action improve completion? These tests can run simultaneously and produce results in days.
The Retention Advantage: Why Iteration Speed Matters
Here's the math that most teams miss:
Traditional mobile development:
- Testing one retention hypothesis: 3+ weeks (development, app store review, user updates, data collection)
- Experiments per year: ~17
- At 20% success rate: ~3.4 meaningful improvements per year
With instant onboarding updates (via Snoopr):
- Testing one hypothesis: 1-2 weeks (just data collection)
- Experiments per year: 50-100+
- At 20% success rate: 10-20 meaningful improvements per year
The team running 100 experiments learns 6x faster than the team running 17. Over a year, that's not a marginal difference—it's a completely different rate of product evolution.
According to Gartner (2025), 80% of future revenue for mobile businesses will come from just 20% of existing customers. Retention isn't just a metric—it's the foundation of sustainable growth.
Quick Reference: 2026 Retention Benchmarks by Category
| Category | Day 1 | Day 7 | Day 30 |
|---|---|---|---|
| Finance/Banking | 30.3% | 17.6% | 11.6% |
| News | 33.1% | — | — |
| Marketplace Ecommerce | 33.7% | 16.1% | 8.7% |
| Gaming (Hyper-casual) | 32.2% | 7.9% | 2.3% |
| Gaming (Hardcore) | 28.7% | 12.6% | 5.4% |
| Social Media | 26.3% | 9.3% | 3.9% |
| General Shopping | 24.5% | 10.7% | 5.6% |
| Health & Fitness | 20% | 7-8.5% | 3.5-4% |
| Productivity | 17.1% | — | — |
| Education | 14-15% | — | 2-3% |
| Photography | — | — | 1.5% |
How Snoopr Helps Teams Beat Retention Benchmarks
Snoopr is a no-code mobile onboarding platform built specifically to help teams improve retention through rapid iteration.
The retention problem Snoopr solves:
Traditional mobile development creates a bottleneck: every onboarding change requires engineering time and app store review. This limits most teams to ~17 experiments per year on their most critical user touchpoint—the first session.
How Snoopr works:
1. One-time SDK integration (~10 minutes for React Native)
2. Visual canvas builder — Create onboarding flows with a Figma-like editor, no code required
3. AI content generation — Generate complete flows (screens, copy, CTAs) in 60 seconds
4. Instant publishing — Changes go live immediately, no app store submission
5. Built-in A/B testing — Test variations with proper control groups
The result: Teams using Snoopr can test 5-10x more retention hypotheses per year, finding winning approaches before users churn.
Start a free trial or book a demo to see how Snoopr can help your team beat industry retention benchmarks.
FAQ
What is a good Day 1 retention rate for mobile apps?
A good Day 1 retention rate is 25-30% for most mobile app categories. The cross-industry average in 2026 sits at approximately 25%, according to Business of Apps. However, benchmarks vary significantly by category: finance apps should target 30%+, gaming apps 28-32%, and education apps may see 14-15% as acceptable. If you're hitting 40%+ on Day 1, you're in elite company regardless of category. The key is comparing against your specific industry benchmark, not a generic average.
What is a good app retention rate for the fitness industry?
Good fitness app retention is 20% on Day 1, 7-8.5% on Day 7, and 3.5-4% on Day 30. Fitness apps face a delayed-value challenge—users don't see results immediately like they would with a banking or news app. According to Statista and Business of Apps data, health and fitness apps consistently underperform the cross-industry average. The fitness apps that beat these benchmarks deliver immediate micro-wins (like completing a first workout) before asking for profile data or signups. Snoopr helps fitness apps test different value-first onboarding sequences to find what maximizes first-session completion.
What is a good app retention rate for the ecommerce industry?
Good ecommerce retention depends on your sub-category: general shopping apps should target 24.5% Day 1 and 5.6% Day 30, while marketplace apps should target 33.7% Day 1 and 8.7% Day 30. According to Growth-onomics, marketplace apps (Amazon, eBay, Poshmark) outperform general shopping apps by 37% on Day 1 and 55% on Day 30. The difference is inherent variety—marketplace apps give users reasons to browse and discover, while general shopping apps often lack this "what's new" pull.
How can I improve app retention quickly?
The fastest ways to improve app retention are: (1) implement push notifications strategically (up to 820% lift), (2) personalize your onboarding (30-50% lift), and (3) reduce time to value below 60 seconds. According to Airship research, sending just one push notification to new users increases retention by 120%. But the biggest lever is iteration speed—teams that can test multiple onboarding variations quickly find winning approaches before users churn. Snoopr enables this by letting product teams update onboarding instantly without engineering dependencies or app store delays.
Why is iOS retention higher than Android?
iOS apps retain 13% more users on Day 1 and 76% more on Day 30 than Android apps. According to Business of Apps, iOS averages 23.9% Day 1 retention vs. Android's 21.1%, and 3.7% Day 30 vs. Android's 2.1%. The gap exists because: (1) iOS devices have more consistent hardware and fewer crashes, (2) iOS users skew toward higher income demographics, (3) Android's broader device range includes more storage-limited phones (storage is the #1 uninstall reason), and (4) Android OS fragmentation creates more edge-case bugs.
What is the DAU/MAU ratio benchmark for mobile apps?
A good DAU/MAU ratio (stickiness) is 20% for most apps, with 25%+ considered excellent. However, this varies dramatically by category: social and messaging apps average 50-80% (WhatsApp hits 83%), productivity tools 40-60% (Slack is ~60%), gaming apps 10-30%, and fintech/ecommerce 15-30%. According to Mixpanel's 2024 report, average stickiness across all industries reached 37% in 2023—up from the historical 13% benchmark—reflecting both improved engagement strategies and market consolidation.
How much do push notifications improve retention?
Push notifications can improve retention by 120% to 820% depending on frequency. According to Airship research: one notification = 120% higher retention, weekly notifications = 440% higher, daily+ notifications = 820% higher. However, 32% of users uninstall apps that send more than 6 notifications, so quality and timing matter more than volume. Critical stat: 95% of opt-in users who don't receive a push notification in their first 90 days will churn.
Sources
- Business of Apps: App Retention Rates 2026
- Growth-onomics: Mobile App Retention Benchmarks by Industry 2026
- UXCam: Mobile App Retention Benchmarks 2025
- RevenueCat: State of Subscription Apps 2025
- Airship: How Push Notifications Impact Mobile App Retention Rates
- CleverTap: DAU vs MAU App Stickiness Metrics
- MobiLoud: Push Notification Statistics 2025
- AppsFlyer: Top Data Trends 2025
- Survicate: Mobile App Engagement 2025